
You launched your support forum three months ago. There are topics and replies. Members are posting. But is it actually working? Is it reducing support tickets? Are community members answering questions? Are the answers accurate?
Without analytics, you are flying blind. You cannot improve what you cannot measure, and you definitely cannot justify the investment to stakeholders if you cannot show them numbers.
This guide covers the metrics that matter for support forums, how to track them, and what healthy numbers look like at different stages of community maturity.
The Six Metrics That Matter
Support forums generate a lot of data. Here are the six metrics that actually tell you whether your forum is healthy and effective.
1. Ticket Deflection Rate
This is the north star metric for any support forum. It answers the fundamental question: is the forum reducing the load on your support team?
How to measure: Compare your monthly support ticket volume before and after launching the forum. Account for business growth (more customers = more tickets regardless of the forum).
Formula: Deflection Rate = (Expected Tickets - Actual Tickets) / Expected Tickets x 100
“Expected Tickets” is what you would have received without the forum, based on your pre-forum trend adjusted for customer growth.
Healthy targets:
| Timeline | Target Deflection Rate |
|---|---|
| 30 days | 5–10% |
| 90 days | 15–25% |
| 180 days | 25–40% |
| 12 months | 30–50% |
2. Community Answer Rate
This measures how much of the support load the community handles independently, without staff involvement.
How to measure: Count the number of questions where the accepted answer was posted by a non-staff member divided by total questions answered.
Formula: Community Answer Rate = Community Answers / Total Answered Questions x 100
Healthy targets:
| Timeline | Target Community Answer Rate |
|---|---|
| 30 days | 5–15% |
| 90 days | 15–30% |
| 180 days | 25–40% |
| 12 months | 35–55% |
If your community answer rate is below 10% after 90 days, you need to invest more in enabling community-powered support, recognizing contributors, seeding more content, and adjusting trust levels.
3. Resolution Rate
What percentage of questions actually get resolved? In Q&A format, this means: what percentage of questions have an accepted answer?
How to measure: Count questions with accepted answers divided by total questions.
Formula: Resolution Rate = Questions with Accepted Answers / Total Questions x 100
Healthy target: 60–80%. Not every question will get a clean resolution, some are opinion-based, some are abandoned by the asker, but the majority should.
If your resolution rate is low, check the “Unanswered” filter in your Q&A spaces. A growing backlog of unanswered questions is a red flag that needs immediate attention.
4. Time to First Response
How quickly does a new question get its first reply? This metric directly affects user trust and return visits. A question that sits unanswered for 48 hours tells the asker: nobody is home.
How to measure: Track the time between question creation and the first reply (from anyone, staff or community).
Healthy targets:
- During business hours: Under 4 hours
- Overall average: Under 8 hours
- 95th percentile: Under 24 hours (almost no question should go unanswered for more than a day)
5. Views Per Topic
This tells you whether existing answers are being found and reused. A topic with 500 views and an accepted answer has deflected potentially hundreds of support tickets.
How to measure: Track page views per topic. Sort by most viewed to identify your highest-impact content.
What to look for:
- Topics with high views and accepted answers = your knowledge base greatest hits
- Topics with high views but no accepted answer = urgent content gaps to fill
- Topics with zero views = poor titles or search optimization needed
6. Active Contributors
How many unique users posted at least one reply this month? A healthy forum has a growing base of contributors, not just a handful of power users carrying the entire load.
Healthy benchmark: 5–10% of registered members should be active contributors in any given month. If your forum has 500 registered members, you want 25–50 people posting replies regularly.
Built-In Analytics vs. External Tools
You can track these metrics through a combination of built-in tools and external analytics.
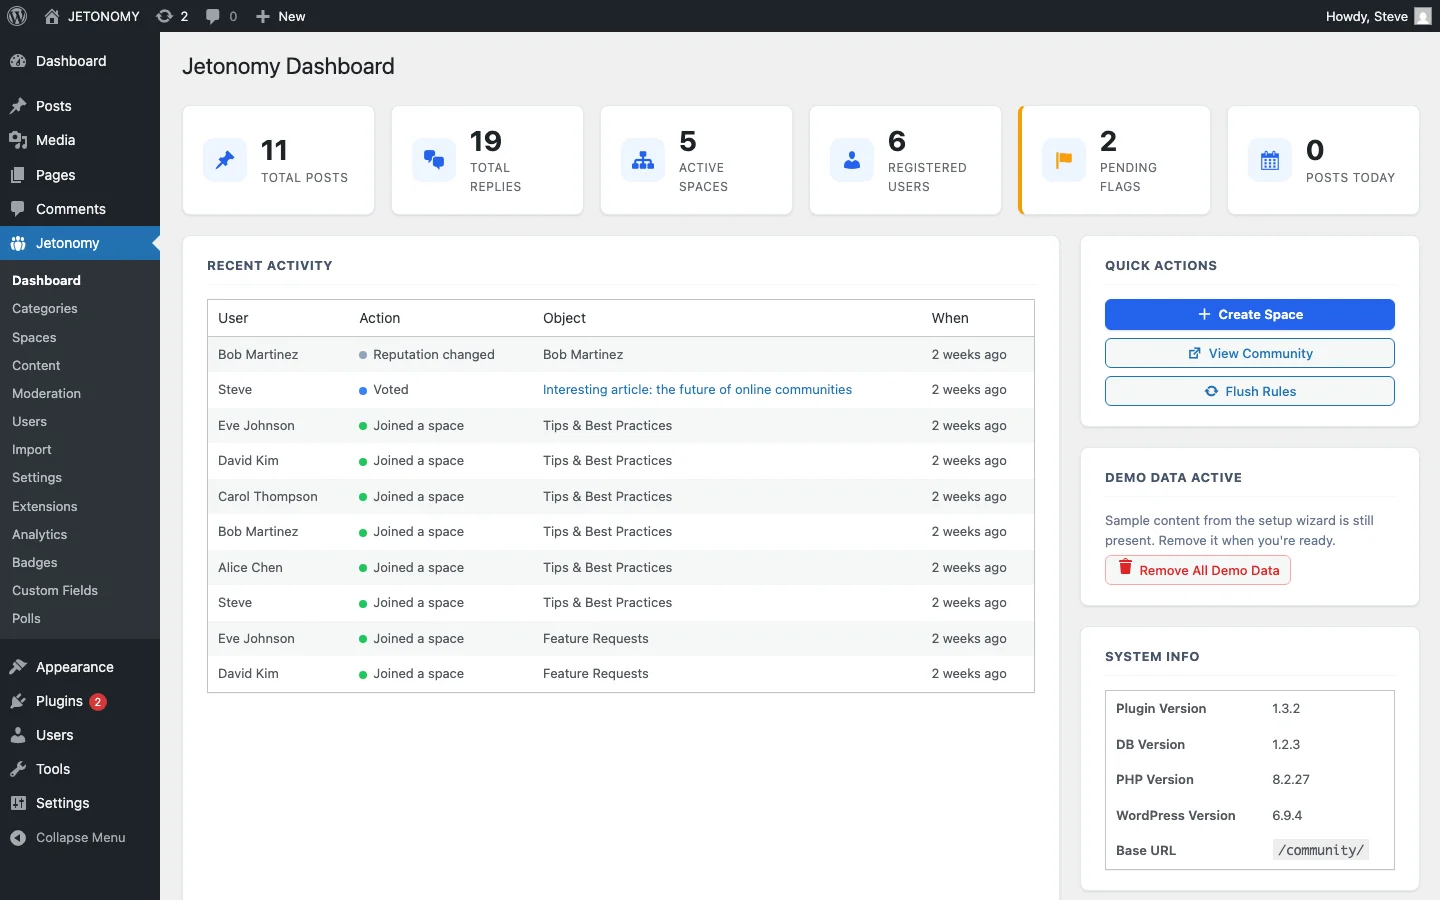
Jetonomy Pro Analytics Dashboard
Jetonomy Pro includes a dedicated analytics extension that tracks:
- Overview: Daily post and reply counts with period-over-period comparison
- Top Spaces: Which spaces have the most activity
- Top Contributors: Ranked by posts, replies, and accepted answers
- Engagement Rate: Active users as a percentage of registered users
- Moderation Stats: Flags, bans, silences, and spam caught
- CSV Export: Download raw data for custom analysis
The analytics dashboard is accessible via Jetonomy → Analytics in the WordPress admin, and also through the REST API at GET /jetonomy/v1/analytics/overview for custom integrations.
Google Analytics
For page-level metrics (views, time on page, bounce rate, search traffic), Google Analytics provides deeper insights. Track:
- Forum page views, Filter by
/community/URL path - Search terms that lead to forum pages from Google
- Bounce rate on forum pages (low bounce = users found useful content)
- User flow from forum to product pages (forum engagement leading to conversions)
Support Platform Integration
If you use Zendesk, Freshdesk, or similar, track your ticket volume trend alongside forum metrics. The correlation between forum growth and ticket decline is the most compelling data point for stakeholders.
Building a Monthly Analytics Report
Create a simple monthly report that covers:
| Section | Metrics | Comparison |
|---|---|---|
| Community Health | Active users, new registrations, posts, replies | vs. last month |
| Support Impact | Ticket volume, deflection rate, resolution rate | vs. last month + pre-forum baseline |
| Content Quality | Accepted answer rate, avg. time to first response | vs. last month |
| Top Content | Most viewed topics, most voted answers | New additions this month |
| Contributors | Top 5 community contributors, new power users | Recognition and outreach |
| Action Items | Unanswered questions, content gaps, moderation issues | Prioritized fix list |
This report takes 15 minutes to compile with Jetonomy Pro analytics and a quick look at your support ticket trends. Export the CSV from the analytics dashboard, pull your ticket numbers, and you have a clear picture of community ROI.
Warning Signs to Watch For
These patterns indicate problems that need attention:
- Rising unanswered rate: More questions are going unanswered. Your team needs to increase monitoring or recruit more community helpers.
- Declining contributor count: Fewer people are answering questions each month. Your power users may be burning out. Invest in recognition and gamification.
- Tickets not declining despite forum growth: Users might not be finding the forum, or the forum content might not match what customers are asking about. Check your self-service funnel.
- High view count but low resolution rate: People are finding topics through search but the answers are not solving their problems. Review and improve your highest-traffic topics.
- Spam increasing: Check your trust level configuration and auto-moderation rules.
Getting Started
You do not need sophisticated analytics from day one. Start with the basics:
- Week 1: Note your current monthly ticket volume (your baseline)
- Month 1: Track posts, replies, and registered users manually from the Jetonomy admin dashboard
- Month 2: Enable the Jetonomy Pro Analytics extension for automated tracking
- Month 3: Create your first monthly report comparing ticket volume to forum growth
- Month 6: Present the ROI to stakeholders with a clear before/after comparison
If you have not set up your forum yet, start with our WordPress forum setup guide. For the support strategy that generates these metrics, read our guide on building a support forum that reduces tickets.
The numbers tell the story. Track them consistently, and your support forum will justify itself within the first quarter.